A. Executive Summary
In this study, the effectiveness of two commercial entities named Dollar Tree and Dollar General is evaluated through the year 2022. Dollar Tree and Dollar General both are part of the discount retailer industry and have variety of chain stores in United States of America. Around more than 15 thousands chain stores of Dollar Tree and around more than 18 thousands of Dollar General working in USA. The core business of the business organizations are food, home goods, seasonal goods, cleaning supplies, fundamental clothing, and health/beauty things.
In this study, used a variety of ratio models, including profitability, liquidity, market, leverage, and efficiency ratios. The total success of both businesses has been examined, and it was determined that performance was inconsistent. For example, according to some ratios models, Dollar Tree and Dollar General both performed well. This study provides evidence that decisions about strategic management are crucial to both survival and growth.
Comparatively, Dollar Trees had less liquidity than Dollar General, which indicates that Dollar General’s short-term ability to pay its debts was deemed to be good. The efficiency of Dollar Tree was shown to be superior to Dollar General at the end of 2022 in this analysis, as well. Despite having a larger net profit margin than Dollar General, Dollar Tree had a lower return on equity. Dollar Tree had better earnings per share and book value per share, but Dollar General had a higher price to earnings ratio.The main corporate policy of Dollar Tree is that no dividends are paid. Dollar General’s debt to equity ratio is greater, which indicates that the company relies more on debt than equity funding. However, Dollar Tree has a greater debt-to-income ratio than Dollar Store. Dollar General has a stronger ability to pay than Dollar Tree when it comes to covering interest costs. As a result, the two companies’ combined performance is mixed in various ratio models. From the investors point of view I will select Dollar Tree for investment.
B. Introduction
Ratio analysis is a mathematical method for understanding a company’s liquidity, operational effectiveness, and profitability by looking at its financial records, such as the balance sheet and income statement. Ratio analysis is an essential part of fundamental equity analysis. Ratio analysis is the process of merely comparing the line items in a company’s financial statements. Ratio analysis is used to evaluate a company’s profitability, operational efficiency, and liquidity, among other characteristics. This type of analysis is particularly useful to analysts who work for organizations other than their own as financial statements are their main source of information about an organization. Ratio analysis is made possible by corporate insiders’ improved access to more comprehensive operational data about the organization.
Table-1 (Data of Dollar Tree and Dollars General for Ratio Analysis)

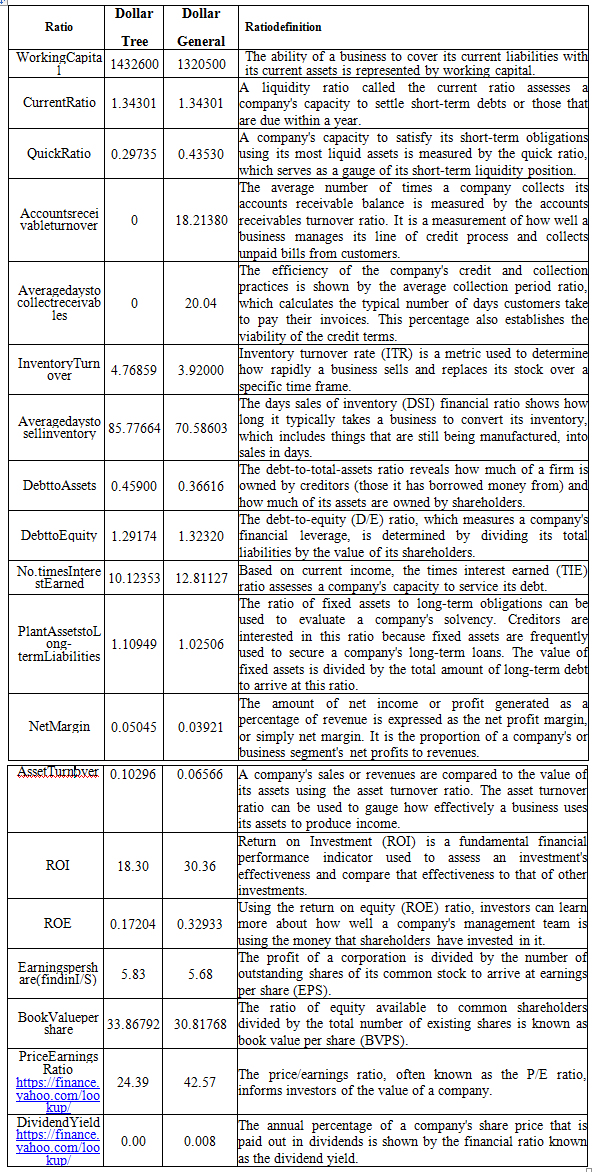
Liquidity Ratios
A liquidity ratio, a type of financial ratio, is used to determine whether a company will be able to fulfil its short-term loan obligations. The indicator helps determine whether or not a company can pay its immediate creditors with its liquid or current assets. The liquidity ratio has an effect on the company’s reputation as well as credit rating. A short-term debt will lead to bankruptcy if payments are repeatedly missed. This ratio is very important to any organization’s credit ratings and financial stability.
- Working Capital = Current Assets – Current Liabilities
- Current Ratio = Current Assets/ Current Liabilities
- Quick Ratio = Current Assets – Inventory / Current Liabilities

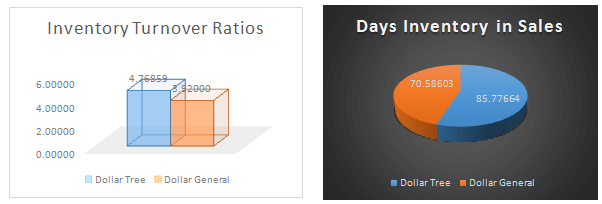
Efficiency Ratios
Efficiency ratios, often known as activity ratios, evaluate how well companies use their resources to generate income. Efficiency ratios usually consider how long it takes a company to complete a sale or convert its inventory to cash. Management employs these statistics to help the company as a whole as outside investors and creditors evaluate the operations and profitability of the organization.


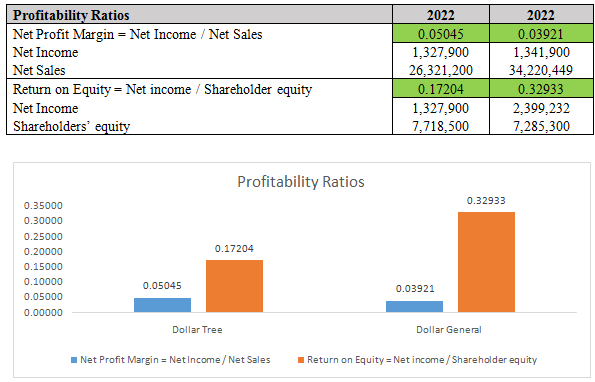
Profitability Ratios
A collection of indicators known as profitability ratios are used to evaluate a company’s capacity for profit-making. When these ratios exceed a trend line or greatly outperform those of competitors, they are considered favorable. Revenues are compared to various kinds of expenses on the income statement to determine profitability ratios. One type of profitability ratio involves comparing the results shown on the income statement to the information on the balance sheet. These subsequent evaluations aim to determine how well management can produce profits in response to the equity or resources at their disposal. If these measures are high, it suggests that resource use has been lowered.
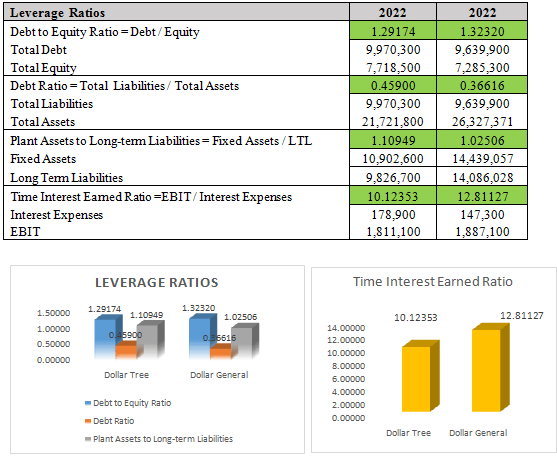
Leverage Ratios
The leverage ratio, which indicates how much of the company’s capital is held in debt, is one of the most important financial figures. It also looks at the company’s capacity to carry out its obligations. When considering the capital structure of the company and how it might be handled to enable it to pay down its obligations, the leverage ratio becomes more significant.
Market Ratio
The current share price of a publicly traded company’s stock is assessed using market value ratios. Current and potential investors use these ratios to assess whether the shares of a company are overpriced or underpriced.

C. Recommendation
Several ratio models, including profitability, liquidity, market, leverage, and efficiency ratios, were used in this study. Examining the overall performance of both firms, it was found that consistency was lacking. For instance, some ratios models predicted that Dollar Tree and Dollar General would both fare well. This study offers proof that strategic management choices are essential to both survival and growth.Dollar General’s ability to pay its debts in the short term was judged to be good because Dollar Trees has less liquidity in comparison. This analysis also demonstrated that Dollar Tree would be more efficient than Dollar General by the end of 2022. Dollar Tree has a poorer return on equity than Dollar General while having a higher net profit margin. Dollar General had a greater price to earnings ratio, but Dollar Tree had higher earnings per share and book value per share.The higher debt to equity ratio for Dollar General suggests that the company depends more on debt financing than on stock funding. The debt-to-income ratio of Dollar Tree is higher than that of Dollar Store, nevertheless. Compared to Dollar Tree, Dollar General has a greater capacity to pay for interest expenses. As a result, different ratio models mix the performance of the two organizations together. I’ll choose Dollar Tree as my investment choice from the perspective of being investor.
Please place the order on the website to get your own firstly done finance homework help result.
Related Samples
Capital Structure Decisions Which Factors Are Reliably Important