Table of Contents
Introduction: ……………………………………………………… 2
What does company do? ……………………………………… 2
Targeted market of the business: …………………………. 2
Corporate governance: ……………………………………….. 2
Reason for choosing this company: ……………………… 3
Weakness of the company: ………………………………….. 3
Strength of the company: ……………………………………. 3
Critical analysis of the Ford Motors ……………………… 3
Limitations of the Ratios Analysis ………………………… 10
Horizontal Analysis of the company ……………………… 11
WACC of Ford …………………………………………………….. 12
Stock price Movement …………………………………………. 13
Conclusion: ………………………………………………………… 13
References ………………………………………………………….. 15
Appendix ……………………………………………………………. 16
Introduction:
The ford Motor is the American multination company in the file of the vehicle manufacturing. It was established in June, 16, 1903 by the Henry Ford. The Ford Motors is the world renounced care manufacturing brand. At the end of 2021, its total revenue was around 136 million dollars. There are approximately 200,000 employees working world wide under the name of the company. Ford Motors has number of subsidiaries and the stock of the company is traded at the New York stock exchange which is one of the biggest stock exchange in the world.
What does company do?
It is an American automobile company and it deals with manufacturing and sales of automobiles. It was founded by Henry Ford and it deals with automobiles. Ford Company sell their vehicles under the name of Ford and also sell luxury cars. Ford has their own manufacturing operations. It designs and manufactures truck and other vehicles.
Targeted market of the business:
The market of ford is spread all over the world. They mostly sale their vehicles to USA and other European countries. They also expect to grow their business in China and India. It has put the world on vehicles and it has been manufacturing all kinds of automobiles according to the needs of the customers. Ford offer good quality cars. The cars have strong safety system and many airbags.
Corporate governance:
Corporate governance is the system that control the business and their activities. Board of directors of the company are responsible for maintaining the corporate governance. The corporate is social responsibility to work in the favor of the country and ford is performing these duties:
- Investment for irrigation
- Education in rural areas
- Promoting gas free industries.
- Reducing carbon foot print
Reason for choosing this company:
The reason for choosing this company that it is listed on New York exchange and has various number of investment option. It has seen in past that it has many positive cash flows and most important it has maintained profitability and sustainability in the market. It has low value of shares which means many of the people can invest in it. They have positive catalyst and it can be used as good long-term investment because of its profitability and sustainability. It also has positive catalyst and can be a good form of investment. They also provide good returns on their shares and keep the price low for new investors.
Weakness of the company:
- One of the major weaknesses is limited global scope of production of ford. It is facing shortage of computer chips and they are making half of the vehicles as compared to the expected products.
- Competitors can also be a threat as well as weakness for the business such as tesla. There is sometimes cut throat business in auto Motors Company. So, tesla and Audi can also be threat to the business.
Strength of the company:
Following are the strength of the company:
- They have highest brand value worth $10.44 billion. They have strong brand worth as they have more reserves of the company.
- They are also performing research and development task and it can also be considered as strength of the company.
- They have earned loyalty of the customers and they have very loyal customers which is considered as strength against competitors.
Critical analysis of the Ford Motors
The critical analysis of the company is done by applying the different methods which are followed.
- Ratio Analysis
- Horizontal Analysis
Ratio Analysis
The ratio analysis is the most widely used method / tool for the evaluation of the companies. By doing ratio analysis all the financial results of the company evaluated. On the basis of different variables, the outcome of the financial analysis will be helpful for all the stakeholders of the company for better decision making. The ratio analysis is presented on the graph so that it would be easy to understand and quickly arrive on the decision.
Following ratios have been applied for the critical analysis.
- Liquidity ratios
- Profitability ratios
- Management efficiency ratios
- Leverage ratios
- Market ratios
Liquidity ratios analysis
Following are the liquidity ratio analysis of the company.
- Current Ratio = Current Assets / Current Liabilities
- Cash Ratio = Cash & Cash Equivalent + short term investment / Current Liabilities
- Quick ratio = Current assets – Inventory/ Current liabilities
Liquidity Ratios
The Liquidity ratios are used by a variety of stakeholders to assess a company’s ability to make short-term payments or meet short-term obligations. Investors, financial institutions, and suppliers commonly use this ratio before entering into a short-term financing transaction. Ford Company has greater short-term assets than short-term liabilities in both years. In 2020, the company’s current ratio and quick ratio was lower than in 2021. As a result, this indicates that a company’s capacity to meet short-term obligations was almost the same in both years, but 2021 was comparatively higher in order to pay short term obligations.

Management Efficiency ratios
The efficiency of the management can be evaluated through different ratios which are followed.
- Inventory Turnover ratio = COGS/Average Value of Inventory
- Fixed Assets Turnover = net sales/ Average Fixed Assets
- Account Receivable Turnover = net sales/ Average Account Receivable
- Assets Turnover ratio = net sales/ Average Total Assets
The efficiency ratios of the company suggest that from the inventory turnover Point Of View Company has higher turnover ratio in 2020 comparatively to 2021 which means company has turned material into saleable products more than 2021, but on the other hand company fixed assets turnover was comparatively higher in 2021 to 2020. The account receivable turnover ratio of the company at the end of 2021 was higher as company was more efficient in collecting from the customers. The net assets turnover of the company was also higher at the end of 2021 which means company has used more effectively to the assets of the company for generating the revenue for the company.
The management efficiency of the company at the end of 2021 was higher and comparatively to 2020 was better. Though in both years company has produced positive results from the efficiency point of view but 2021 was better than 2020.

Profitability ratio
The profitability can be evaluated through different ratios which are followed.
- Gross Profit Margin = Gross Profit / Net Sales
- Operating Profit Margin = Operating income / Net Sales
- Net Profit Margin = Net Income / Net Sales
- Interest coverage ratio = EBIT / Interest Expenses
- Return on Assets = Net Income / Total Assets
- Return on Equity = Net income / Shareholder equity
The profitability ratios of the company

The above table and graph shows that the year ended 2020 was not profitable from the profitability ratios point of view. The net income of the company was negative at the end of 2020. But in 2021 company has recovered from the negative inflow to positive inflow of revenue.
Leverage Ratios
The leverage ratio of the company are followed.
Debt to equity ratio = Debt / Equity
Debt ratio = Total Debt / Total Assets
The leverage ratio of the company given in the following table and graph. The leverage ratios of the company suggest that at the end of 2020 company has used more debt to equity comparatively to 2021. The debt ratio of the company at the end of 2020 was also higher which means that total assets of the company was financed with debts was higher in 2020 to 2021.

Market Ratios
The market ratios of the company are followed.
- Earnings Per Share = Net Income / Out Standing Shares
- Price to Earnings Ratio = Earing per share / Stock Price
- Dividend Yield Ratio =Dividend per share / Market Share price
The market ratios of the company also suggest that 2021 was higher and much better than the 2020 from investors and shareholders point of view. The earning of the company at the end of 2020 was negative which cause negative returns and decreases in the wealth of the shareholders. At the end of 2021 company earned the positive returns for the shareholders which increases the wealth of shareholders.

Limitations of the Ratios Analysis
Though ratio analysis is widely used by all the stakeholders for financial analysis of the companies. It is highly accepted and reliable in order to take the financial and managerial decision. Using mathematical ratios to analyses the statistics in a financial statement may help you gain a better understanding of how a company operates while also alerting you to potential trading and investment opportunities. But in spite of highly acceptable method of financial analysis of the company’s financial reports, it has some limitations as well which are followed.
- The ratio analysis is basically on the historic data rather on the current.
- The ratio analysis does not account or consider the economic situation in the country or in the world.
- The collective human efforts in ratio analysis is ignored which have largely impact on the financial performance of the company.
- Ratio analysis is used for comparative analysis between two companies of same size and type.
The impact of ratio analysis on Stakeholders of the company
Ratio analysis play vital role in decision making by all the stakeholders like investors, customers, financial institutions, investors. Suppliers and creditors. If company wants to get the credit either from the financial institutions or directly from the public, than ratio analysis will be helpful for both public and financial institution in order to guess the financial strength and payback capabilities.
Similarly ration analysis is helpful for suppliers of the company before entering into agreement for supply of raw material or any material related to their products. By doing ratio analysis, supplier can guess the short term and long term payment capability of the company along with their products sold in the market and payment circle in days to their creditors. Ratio analysis is has the highest impact or helpful for investors before investing in the company by purchasing of shares in the market or different types of company securities.
Horizontal Analysis of the company

The horizontal analysis of the company suggest that year 2021 was much better than 2020. The cash flow analysis of the company suggest that company has more invested in the fixed assets and other investments which will later increase in the total revenue of the company and overall increases in the wealth of the shareholders.
WACC of Ford

Stock price Movement
The stock price of the company since January 2020 to 31st December 2021 is presented in the following graph.
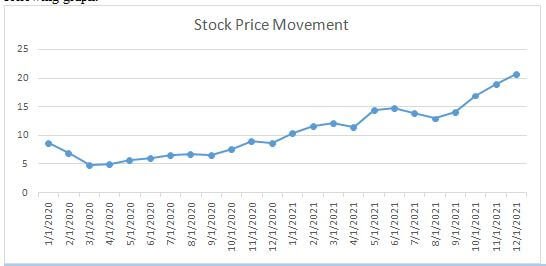
The graph of the stock price of the company suggest in the beginning of the 2020 year the price of the company stock get down but since march 2020 the stock price is going upward or gaining in every next month. The stock of the company comparatively to January 2020 was much higher at the end of December 2021.
Conclusion:
The main conclusion is that it is highly recommended to make investment in this company because after analyzing the financial position and performance of the company it is shown that company has good performance and it will be beneficial if invest in this Ford Motor. It is recommended to make investment in the company after analyzing all the factors and outcomes of the investment. In this case, it is seen it is good to make investment, as price is going up and there is also increase in earnings per share. Company is also investing in technology and company will grow more in future. From the investment point of view, it creates a good chance for investment so it is recommended that investment should be made in this. The cash flows of the company are positive and company is making progress and it is seen that in near future there will be increase and growth in the company so it is recommended to invest in the company because of profitability and better performance of the company. A investor must seek a good profit and this company is better choice for this objective as it aims to generate profit and it has market all over the world and it is creating and growing gradually and it increases the chances of your investment betterment.
References
- (2017). “Why Amazon Is The World’s Most Innovative Company Of 2017” https://publicaffairs-sme.com/PatriotFamily/wp-content/uploads/2015/01/Why_Amazon_is_most_innovative_company_13_Feb_2017.pdf
- Edward and Lincoln. (2018). “Porter Analysis: A Business Strategy of Amazon.com Through a Value Chain and Comparative Advantage Analysis of Amazon’s Trademarks and Intangibles” https://papers.ssrn.com/sol3/papers.cfm?abstract_id=3234380
- (2008). “Jeff Bezos and Amazon.Com” https://papers.ssrn.com/sol3/papers.cfm?abstract_id=1280551
- Hong, Bhattacharyya and Geis. (2012). “The Role of M&A in Market Convergence: Amazon, Apple, Google and Microsoft” https://papers.ssrn.com/sol3/papers.cfm?abstract_id=2165444
- Kumar, Eidem and Perdomo. (2012). “Clash of the e‐commerce titans: A new paradigm for consumer purchase process improvement” https://www-emerald-com.adu-lib-database.idm.oclc.org/insight/content/doi/10.1108/17410401211263872/full/html
- (2002). “A business history to appear in e-commerce management: text and cases” https://paginas.fe.up.pt/ipc/suporte/varios/amazon_final.pdf
- Pandit and Poojari. (2014). “A Study on Amazon Prime Air for Feasibility and Profitability– A Graphical Data Analysis.” http://www.iosrjournals.org/iosr-jbm/papers/Vol16-issue11/Version-1/B0161110611.pdf
- (2013). “Inventory Turnover Ratio Analysis” https://strategiccfo.com/inventory-turnover-ratio-analysis/
- Al Nuaimi, Aysha and Nobanee, Haitham, Corporate Sustainability Reporting and Corporate Financial Growth (2019). Available at SSRN: https://ssrn.com/abstract=3472418 or http://dx.doi.org/10.2139/ssrn.3472418
- Al Ahbabi, Al Reem and Nobanee, Haitham, Conceptual Building of Sustainable Financial Management & Sustainable Financial Growth (October 19, 2019). Available at SSRN: https://ssrn.com/abstract=3472313 or http://dx.doi.org/10.2139/ssrn.3472313
- Almarar, Fatima and Nobanee, Haitham, Sustainability and Risk: A Mini-Review (2020). Available at SSRN: https://ssrn.com/abstract=3539058 or http://dx.doi.org/10.2139/ssrn.3539058
Appendix
Please place the order on the website to get your own firstly done finance homework help result.
Related Samples